In this blog post, MICRO co-PI Dr. Paul Gignac shares some tips and tricks for diceCT staining natural history specimens, which allows for the visualization of soft-tissue structure in CT scans.
What is diceCT?
Pronounced daɪsˌsiˌti, the acronym stands for “diffusible iodine-based contrast-enhanced Computed Tomography.”
What problem does diceCT solve?
Dense materials like bones and teeth absorb X-rays, which makes it possible to image them using X-ray based technologies such as micro-computed tomography (µCT) imaging. Low-density materials, like the soft parts of plants and animals contain a great deal of water, which is X-ray transparent. As a result, muscle, sinew, nerves, glands, and epithelial anatomy is typically “invisible” to X-ray imaging tools.
DiceCT overcomes this limitation by providing MRI-like tissue visibility at resolutions higher than µMRI.
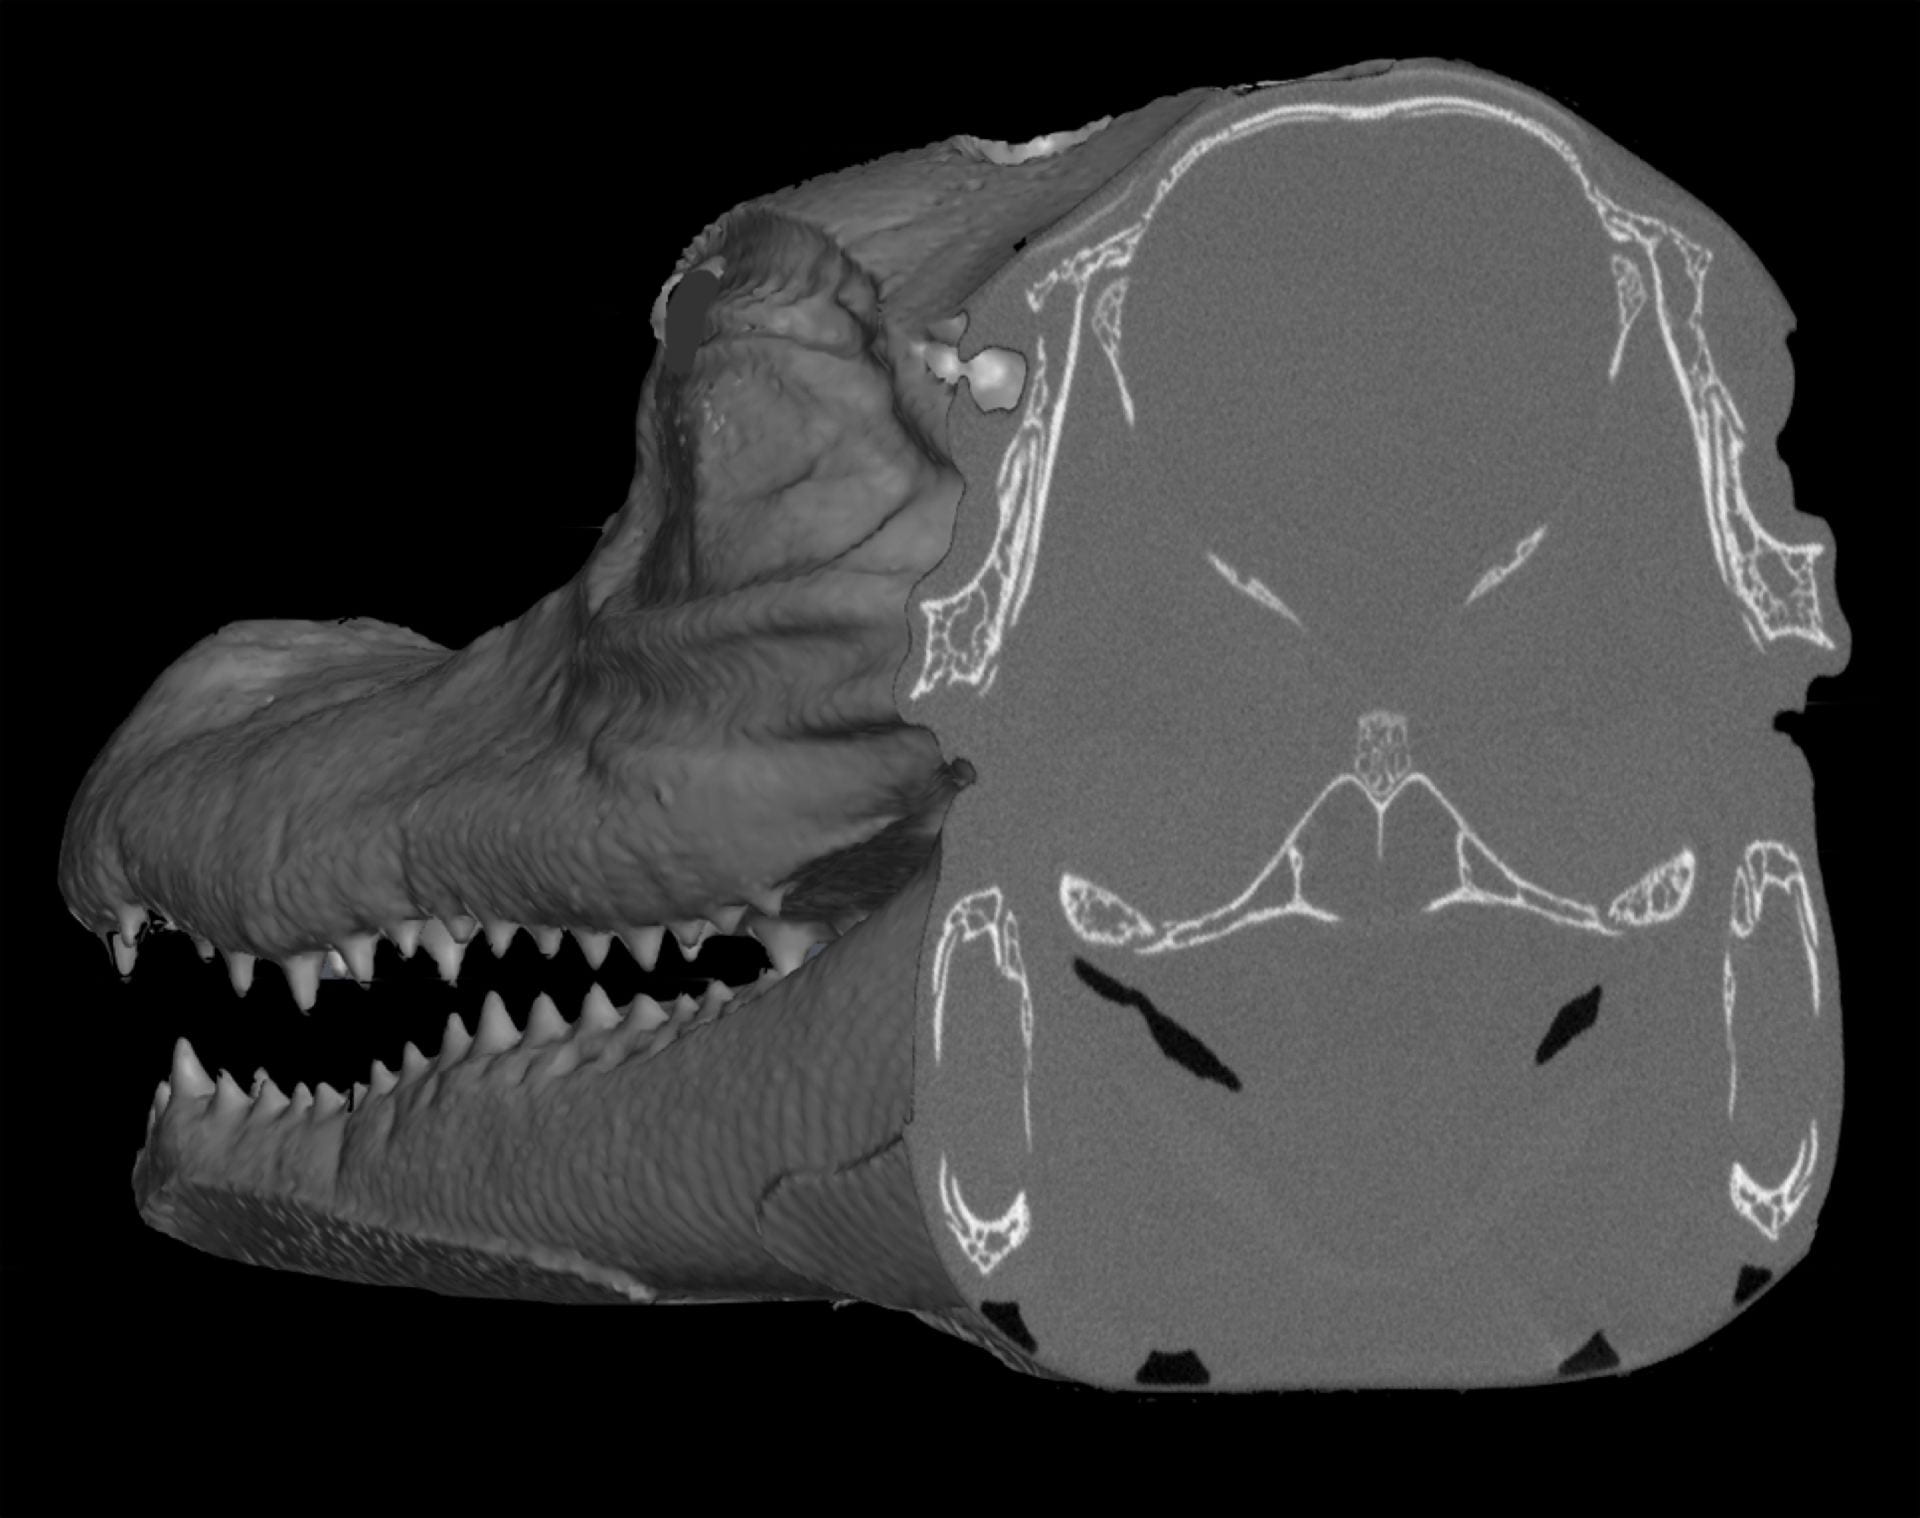
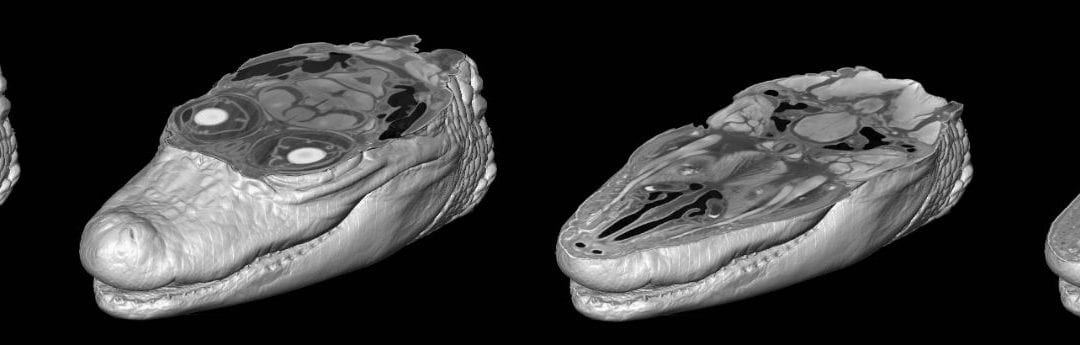
In a standard CT scan, bone and teeth show up well, but soft structures like muscles and the brain are unresolved.
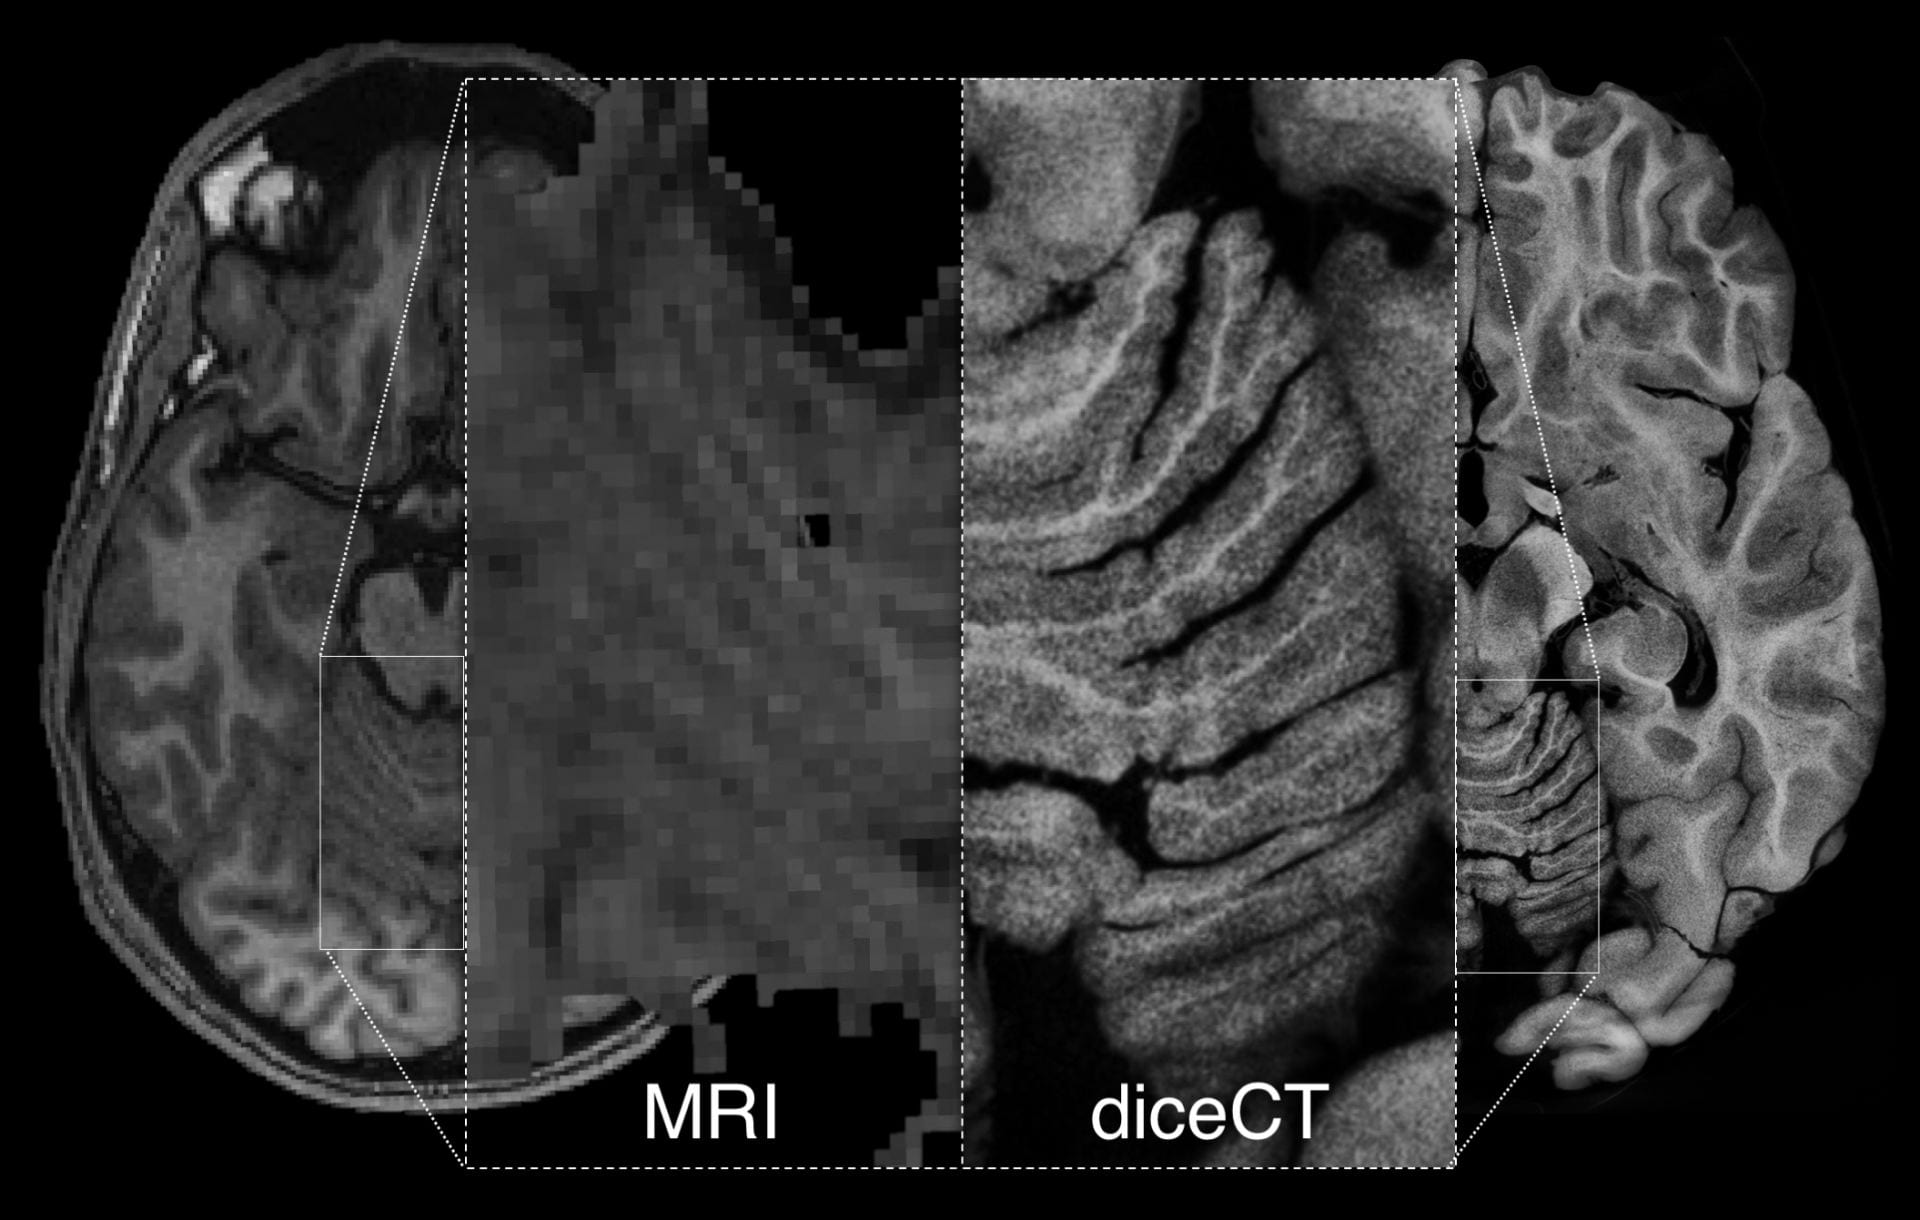
T1 weighted MRI and diceCT human brains from Gignac & Kley (2018), illustrating similar tissue contrasts but higher resolution achieved with µCT imaging.
How does diceCT work?
Organs or whole organisms are first chemically fixed using 10% neutral buffered formalin, ethanol, or methanol, and then they are fully submerged in a solution of iodine. Iodine diffuses through the soft tissues and binds differentially to fats and sugars that are naturally present within these tissues. As a result, previously X-ray transparent, low-density soft structures are made far denser, which allows them to be seen by X-ray imaging tools like µCT scanners.
How are staining agents prepared?
Iodine crystals dissolve directly into 100% (or near 100%) ethanol (I2E) and methanol (I2M). For water-based iodine solutions (called “Lugol’s Iodine,” “strong solution,” or “iodine potassium-iodide”), iodine crystals readily dissolve in the presence of potassium ions (I2KI).
I2E, I2M, and I2KI can be created at various weight-by-volume (w-v) concentrations. This metric amounts to how many grams of solid material (solute) is dissolved into either ethanol, methanol, or water to create 100 ml of solution. For example, 1% I2E is mixed from 1 gram of I2 crystals and 99.80 ml of 100% ethanol, whereas 1% I2KI is mixed from 0.33 grams I2 crystals, 0.67 g KI crystals, and 99.72 ml of (typically de-ionized or distilled) water.
Concentrations for biological applications typically range from 1–3% w-v which are approximately in line with the osmotic balance of various soft tissues. A helpful spreadsheet that outlines how to calculate weight-by-volume concentrations for iodine solutions can be found here.
How long does a sample need to stain?
Length of exposure to the staining agent depends on the size of the sample and the concentration of the staining solution. Embryonic samples are often stained just overnight. Larger, post-embryonic samples typically take at least a week and often several weeks to fully stain. At low concentrations, the contrast agent solution might become clear as the iodine is fully moved into the sample. When this happens, it is necessary to refresh the contrast agent to recharge available iodine so that staining can continue.
For a spreadsheet of example staining concentrations and durations, see Table S4 of Gignac et al. (2016)
Trade-offs in time and contrast
Samples stained at higher concentrations will stain more rapidly than those at lower concentrations. However, rapid changes in osmotic pressure like those produced by submerging biological tissues into salty environments, such as high concentration solutions of iodine can lead to tissue distortions (e.g., physical displacement) as well as shape change and shrinkage. Lower concentrations are, therefore, strongly recommended to maintain fidelity of the target anatomy, which also means that you should plan ahead to complete staining in time for scheduled CT scanning opportunities.
De-staining iodinated samples
One of the primary advantages diceCT over other contrast agents is that the stain is reversible. Over many months stain can be physically washed out of a sample using a series of water or ethanol/methanol baths. Iodine in solution is visibly red/bronze in color, but it can also be transformed into a colorless form that is also transparent to X-rays using sodium thiosulfate (Na2S2O3). Alternating water and sodium thiosulfate baths (at ~1% w-v Na2S2O3) can return your sample to its original state within a few weeks.
De-staining, therefore, allows for post-diceCT dissection, use of museum specimens for 3D imaging research, and/or re-use of the same sample for subsequent histological staining to provide reciprocal illumination from cellular to whole organism levels of anatomical organization.
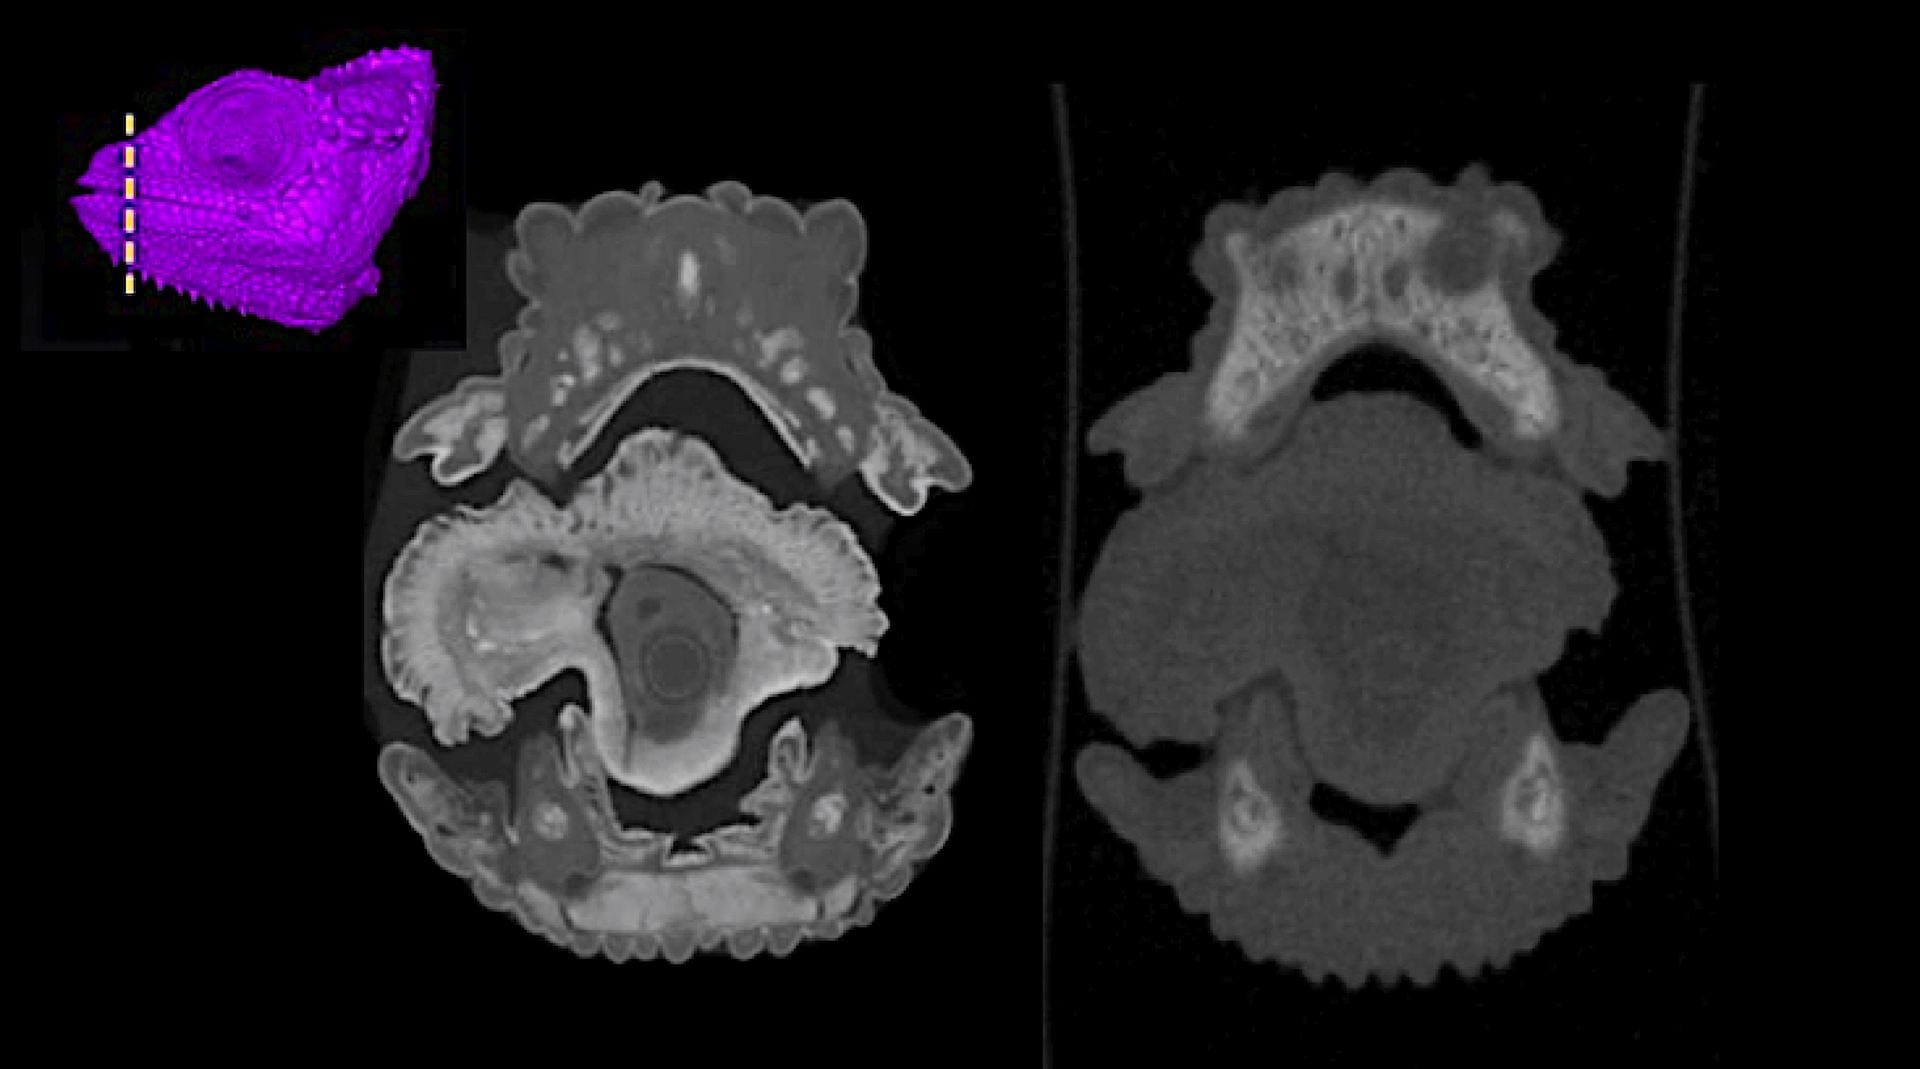
Anatomy of a chameleon tongue shown via diceCT (left) and at the same location after de-staining (right), illustrating that soft structures are no longer stained. (See Hughes et al. [2016] for additional visualizations)
Additional considerations
DiceCT is an ex vivo procedure that is incompatible with living tissue.
High-resolution µCT scans produce datasets that are several gigabytes in size, which require substantial computation resources to process into 3D digital models.
µCT scanners are not inherently set up to provide absolute grayscale values (e.g., like is common for hospital CT scanners), meaning that diceCT grayscale values of the same tissues prepared identically across multiple scans are not necessarily going to be identical. (Note: it is possible to calibrate absolute grayscale values for a series of scans using known-density phantoms.)
Iodine binds poorly to connective tissues, which limits the visibility of ligaments, tendons, cartilages, and similar structures in diceCT scans.
3D imaging software utilizes contrast differences to automate the rendering process. This means that researchers interested in both skeletal/dental and soft-tissue anatomy are well served by scanning a specimen prior to staining in order to capture hard-tissue anatomy that can be easily rendered into a digital model, followed by diceCT imaging of the same specimen. The two datasets can be subsequently combined within one volume using 3D rendering software.
Particularly large specimens may need to be dissected to isolate smaller regions or interested or be stained via vascular perfusion (“spiceCT”, developed by the Wimter Lab at Ohio University).
Recent Comments